Hello Swift Charts - WWDC 2022
Peter Yaacoub •


Introduction
Swift Charts is Apple’s newest Swift framework for building beautiful charts with declarative syntax. Read this article to find out how creating charts in your apps is now as easy as pie!
Swift Charts is built with accessibility in mind to describe charts for visually impaired users. Besides, you can effortlessly use them with animations, localization, and on all Apple platforms.
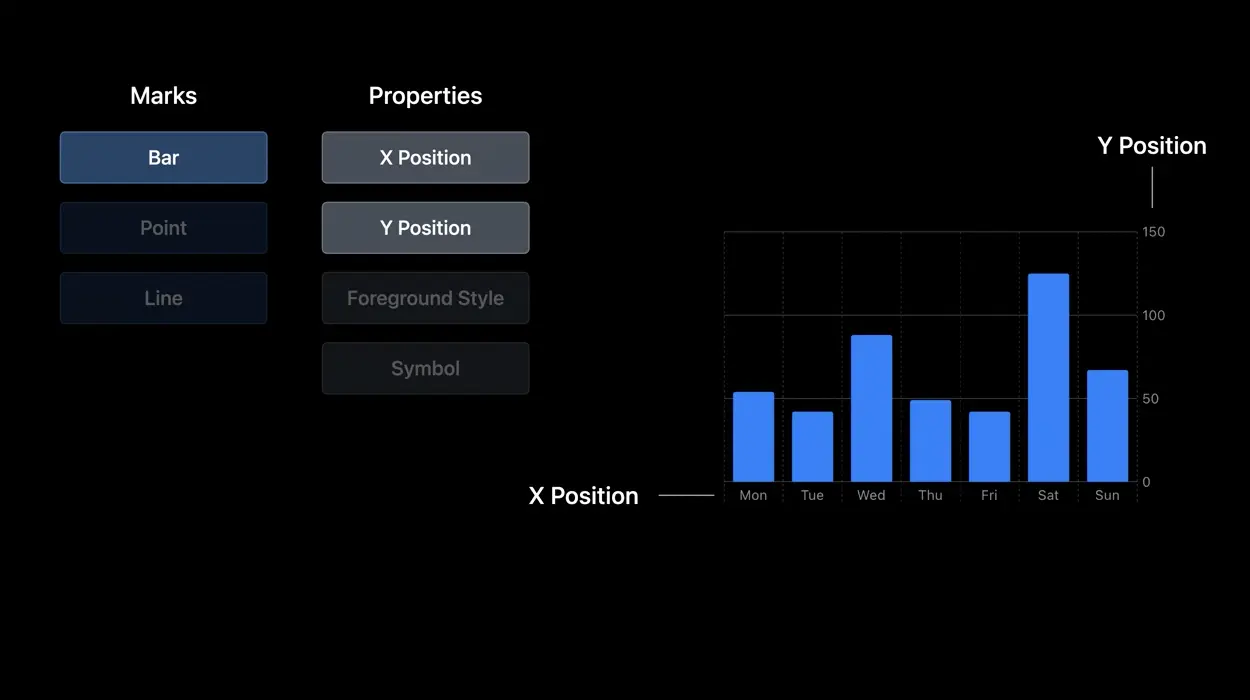
Bar Chart
import Charts
import SwiftUI

struct ChartView: View {

    private let data = [/* your data here */]

    var body: some View {
        Chart(data) { element in
            BarMark(
                x: .value("Name", element.name),
                y: .value("Points", element.points)
            )
        }
    }

}
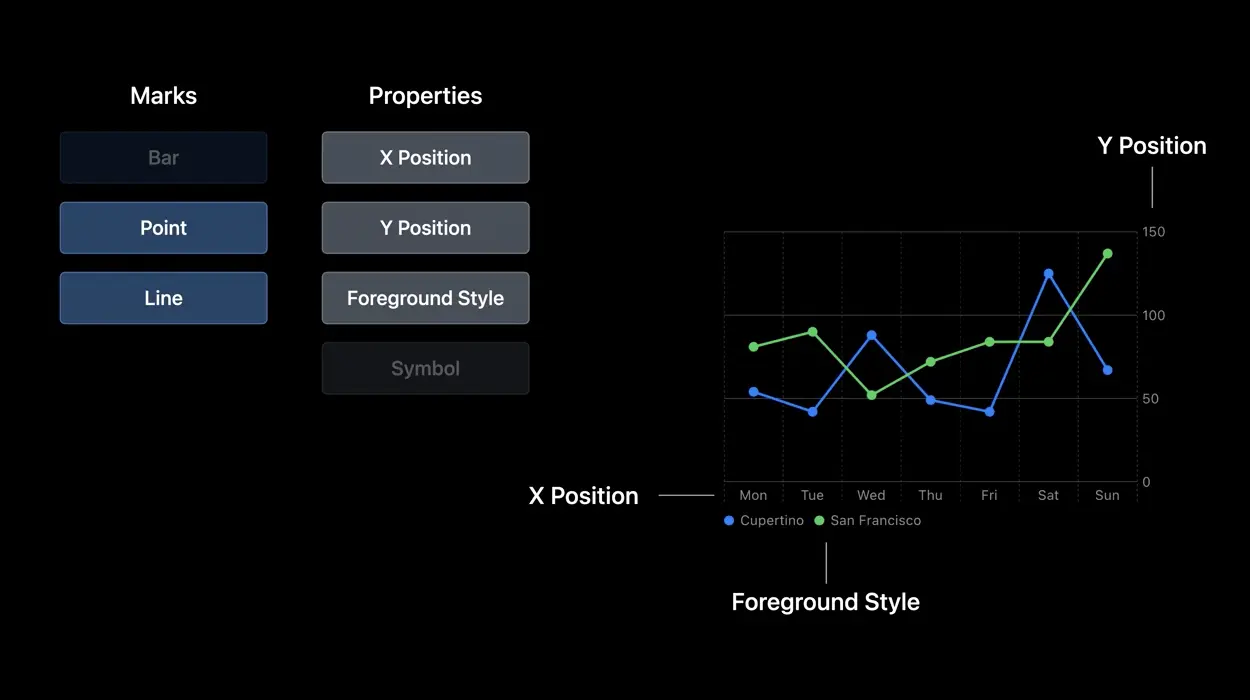
Multi-Series Line Chart
import Charts
import SwiftUI

struct ChartView: View {

    private let serie1 = [/* your data here */]
    private let serie2 = [/* your data here */]

    var body: some View {
        Chart([serie1, serie2], id: \.self) { serie in
            ForEach(serie) { element in
                LineMark(
                    x: .value("Year", element.year),
                    y: .value("Points", element.points)
                )
                .foregroundStyle(by: .value("Name", element.name))
            }
        }
    }

}
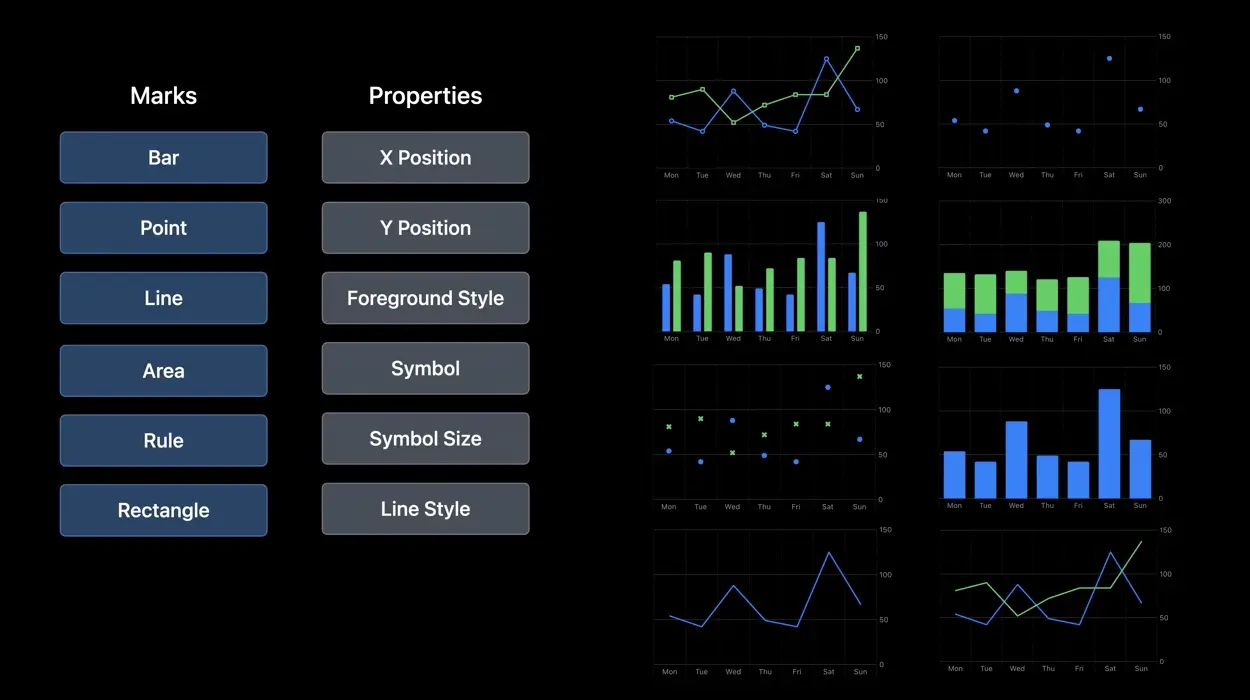
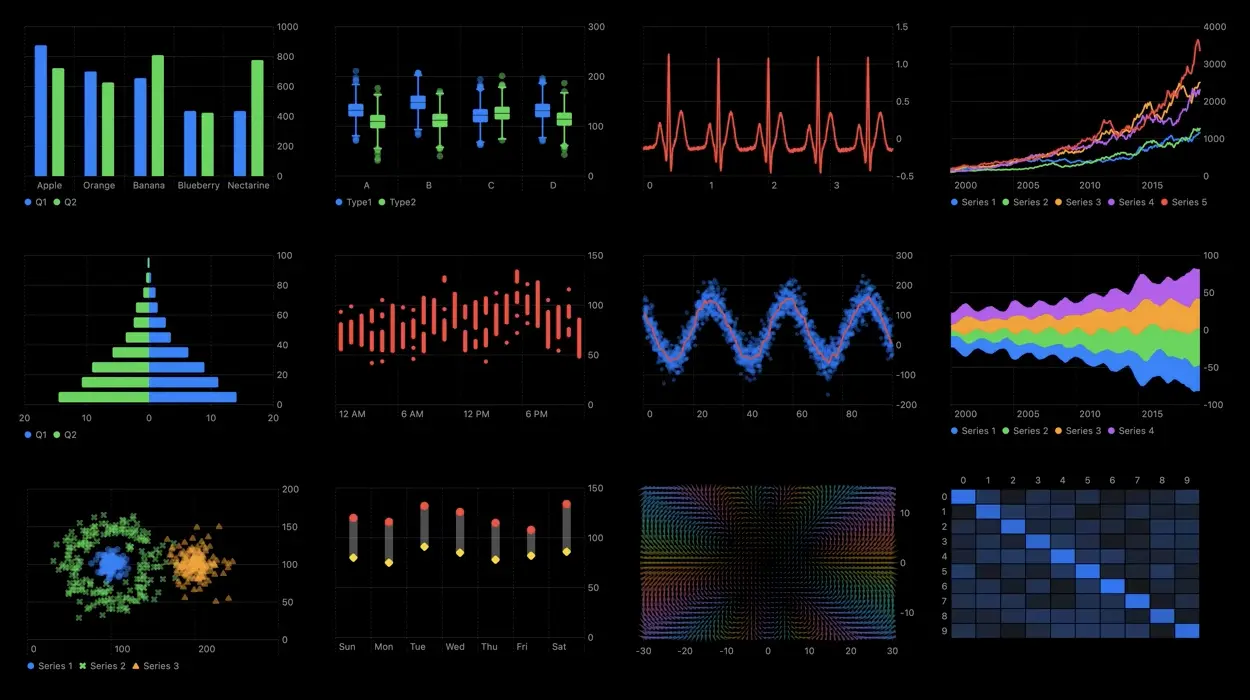
Other Charts
There are six types of marks that you can use individually or together to create complex charts:
You can also customize their appearance with the .foregroundStyle(by:) and .symbol(by:) instance methods. Other methods also allow you to modify the symbol size and the line style.
Conclusion
This article summarizes Apple’s WWDC22 session 10136: Hello Swift Charts, which I enjoyed watching. Apple engineers have done a great job by making it easy to express your ideas with charts!
